Ad

Android 11 is at the top of the 2022 Distribution Ranking | and Android 12 is Missing
1,754 views
Follow Us:
1,754 views

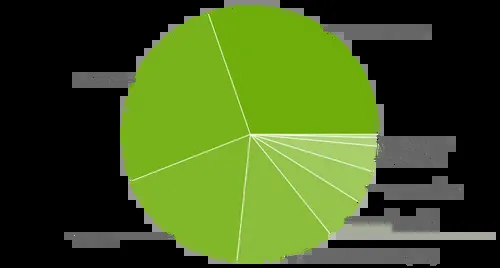
According to the sources, at first, Google made this information freely available on the internet in the form of a constantly updated pie chart that assigned a percentage to each Android version. This data, on the other hand, worked against Google because it was used to contrast Apple's much higher rate of adoption for new iOS versions. Over time, this chart became less frequently updated and was eventually removed.
Google has recently taken a new approach to the Android distribution chart, bringing the data inside Android Studio in a format that indicates what percentage of devices are running a specific version or newer. The Android Studio chart is now updated every six months to a year, with the most recent version arriving in November and a new version arriving on May 9.
Android 11 at the Top
Smartphones running Android 11 and newer now account for 28.3 percent of the pie, up from 24.2 percent in 2022 distribution data. Given the prevalence of Samsung smartphones and how the company keeps even its low-cost handsets updated, even up to Android 12, this is not surprising.

In line with this, the percentage of devices still running Android 10 has fallen to 23.9 percent, down from 26.5 percent in November. Each successive version of Android has seen a similar decline in usage, with Jelly Bean now accounting for less than half of all Android devices.
About the Android 12
This chart's lack of Android 12 data is most likely due to its intended audience of Android developers. The Play Store's minimum API requirements should suffice rather than serve as a guide to which Android APIs your app should target. The Android Studio chart is intended to help developers decide which Android versions should be supported at all.
Developers can use statistics to calculate how many potential customers they will lose if they do not support an older Android version. Knowing how many Android 12 or 12L users there are isn't particularly useful for this purpose. However, the statistics could be extraordinarily exciting to examine, specifically given that statistics for Android 12 and 12L could be broken up because of specific API variations.
Latest News


Reviews & Guides
View All

Nothing Phone 3a Community Edition First Impressions: A Fresh Take on Budget Smartphones

Realme P4x 5G Review: Budget-Friendly Beast with Epic Battery Life

Sony BRAVIA 7 Mini LED K-65XR70 vs. Haier Mini LED H65M95EUX

Samsung QN90F (65QN90FAU) Review: The King of Bright-Room Viewing

Best Air Purifiers for Asthma Patients

Single Door vs Double Door vs Side-by-Side Refrigerators

Best LG Washing Machines in India

Best Cameras Under ₹50,000 in India


